Introduction
The COT Reports are published by the Commodity Futures Trading Commission (CFTC) in the US. The CFTC took over from the Commodity Exchange Authority (CEA) in 1974 because the futures market grew beyond agricultural products into complex financial instruments (like interest rates, stock indexes and currencies) and needed an independent, specialized federal agency with broader oversight. Congress passed the Commodity Futures Trading Commission Act of 1974 to establish the CFTC as an independent agency to regulate futures and options markets in the US.
The CFTC provides futures contract reports that capture the supply and demand of commodity futures contracts across different US exchanges. These reports are released weekly every Friday at 3:30 pm EST (3 days after the reports are actually reported). Figure 1 shows a sample short form COT report for Pound-US Dollar for 09/23/2025 released on 09/26/2025.
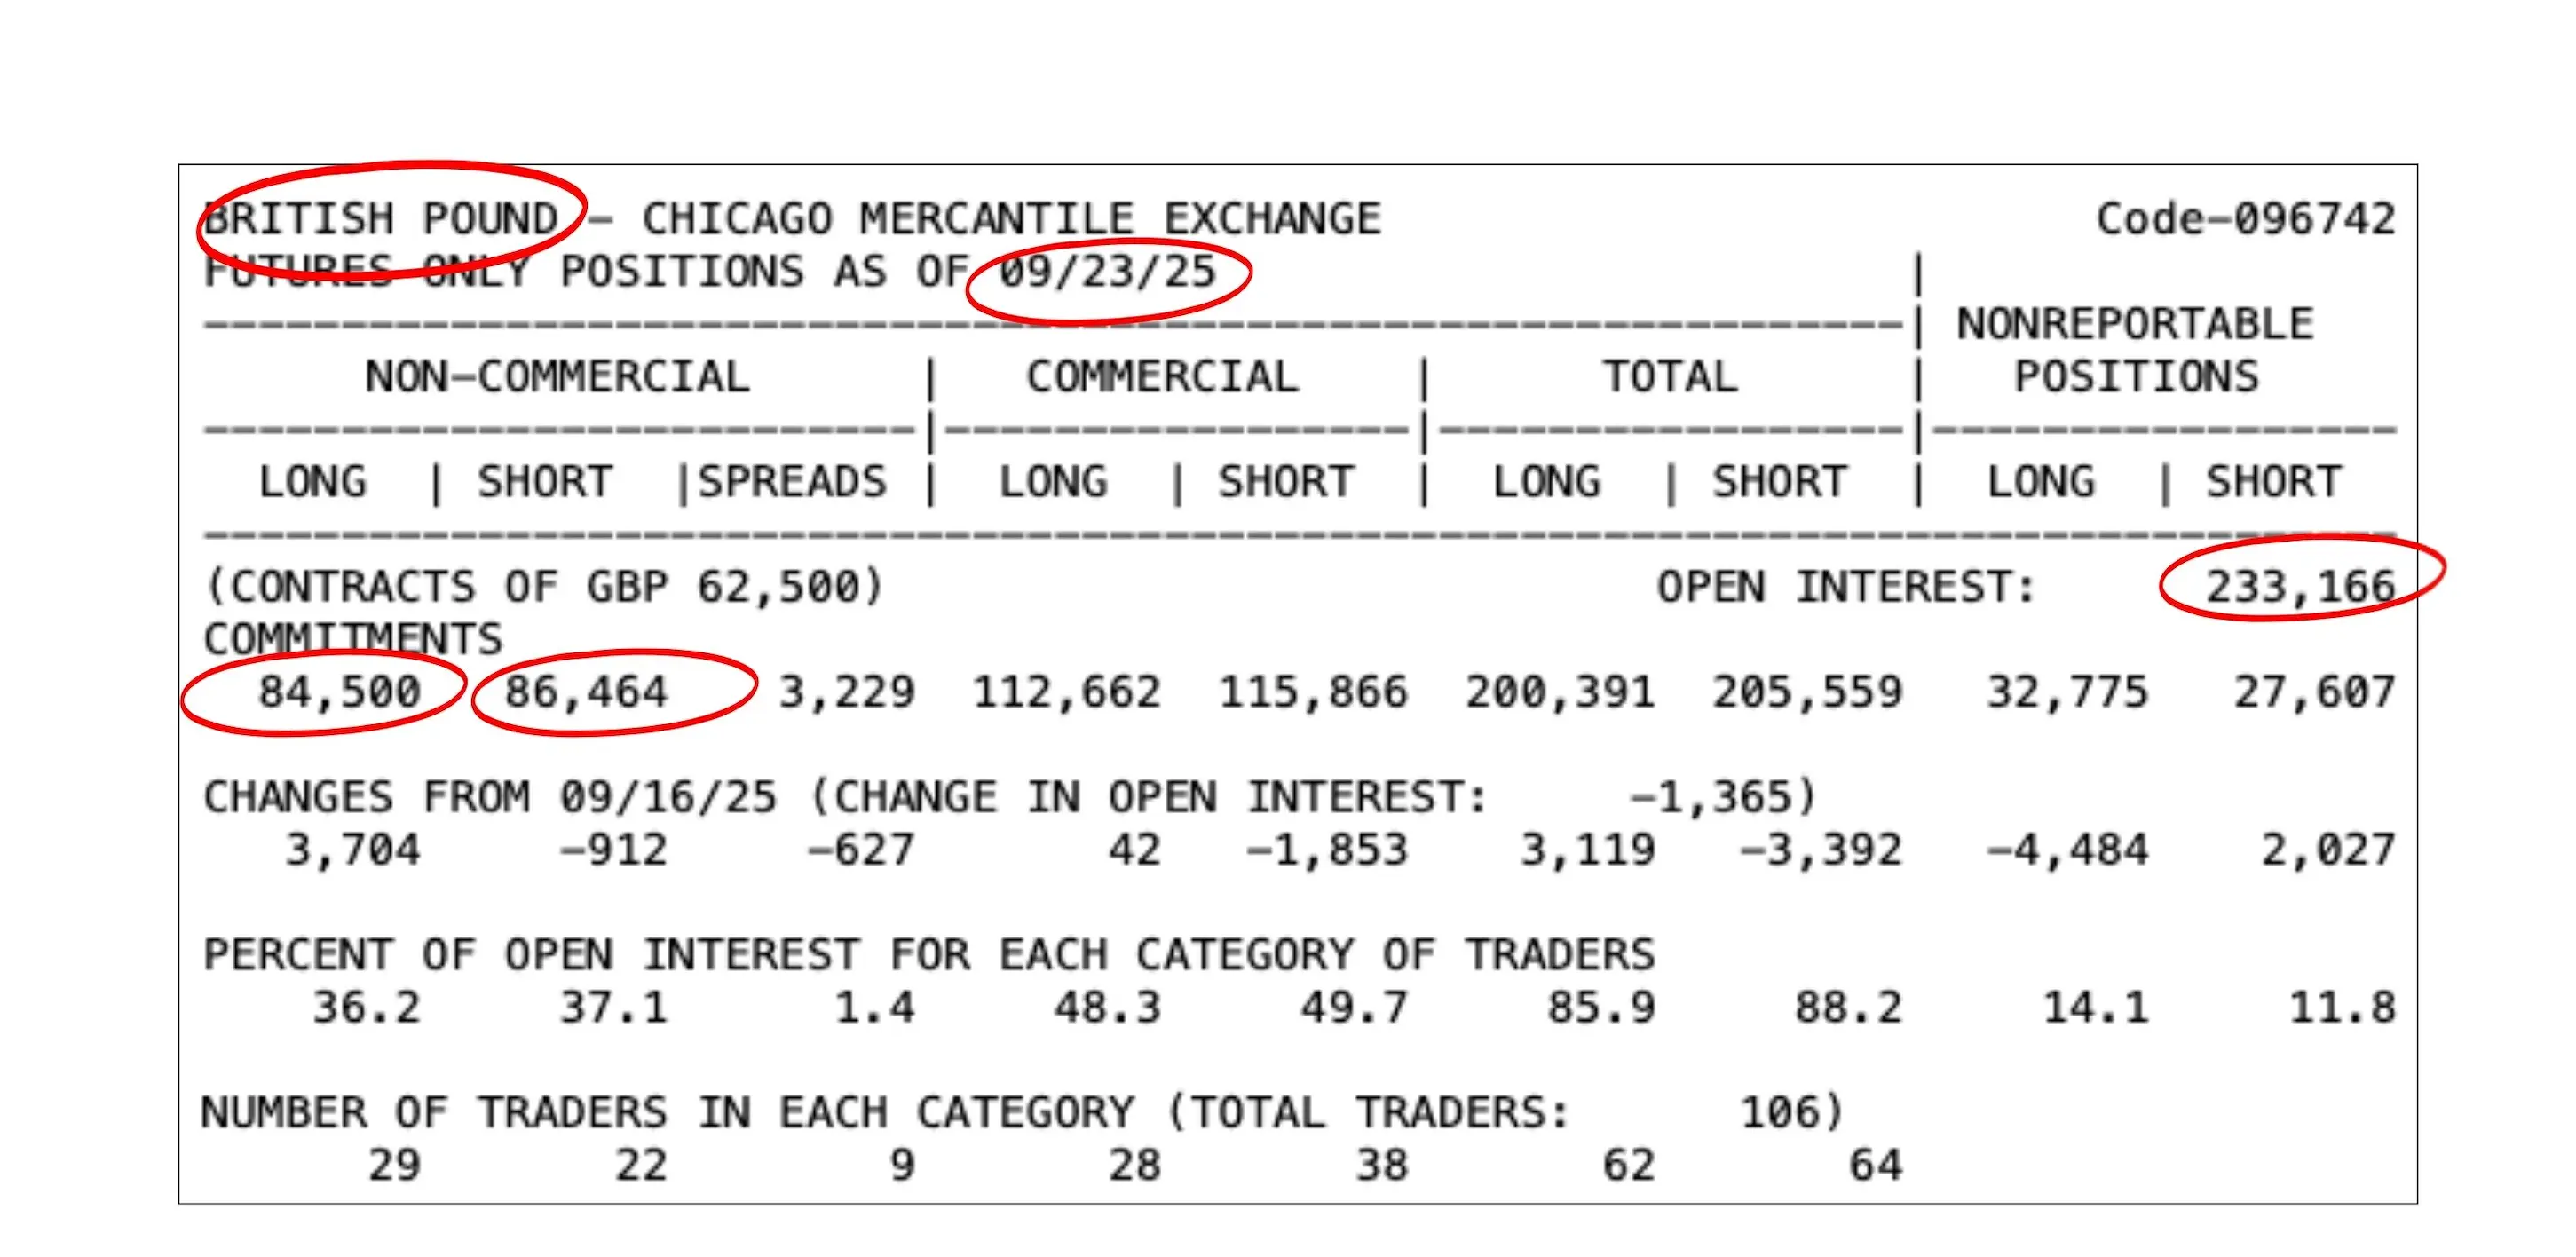 Figure 1: Sample COT Short Form report for GBPUSD 09/23/25
Several studies have shown that COT reports can be used to predict futures price movements in various markets, including commodities, currencies, and stock indices. In the Commitment of Traders Bible by Stephen Briese, he shows how this could be done using the COT indicator he derived from the reported Commercial/Non-Commercial long and short positions.
In this blog post, we will focus on some elements of Stephen Briese's approach while adding our own insights. For instance, just like Briese, we demonstrates the positive relationship between the Non-commerical longs-short positioning with the futures price action. Also, we take a step further showing how to take trades once we know who the predominant market mover is (buyers/sellers).
The important information we choose to focus on in the COT report are the non-commercial long and short contracts and the open interest.
- Non-commercial longs are the total number of long contracts opened by major speculators (big institutional players, hedge funds etc.)
- Non-commercial shorts are the total number of short contracts opened by major speculators (big institutional players, hedge funds etc.)
- Open interest is the total number of unresolved futures contracts. More means existing people are holding and not selling their positions.
- The longs and shorts contracts of non-commercials can be used to calculate the Net Positioning of traders for a particular futures market.
We have curated the data from several of these reports into a nice excel sheet. To view COT report for various markets, please click here.
How to Use COT Reports in Trading (a focus on Gold)
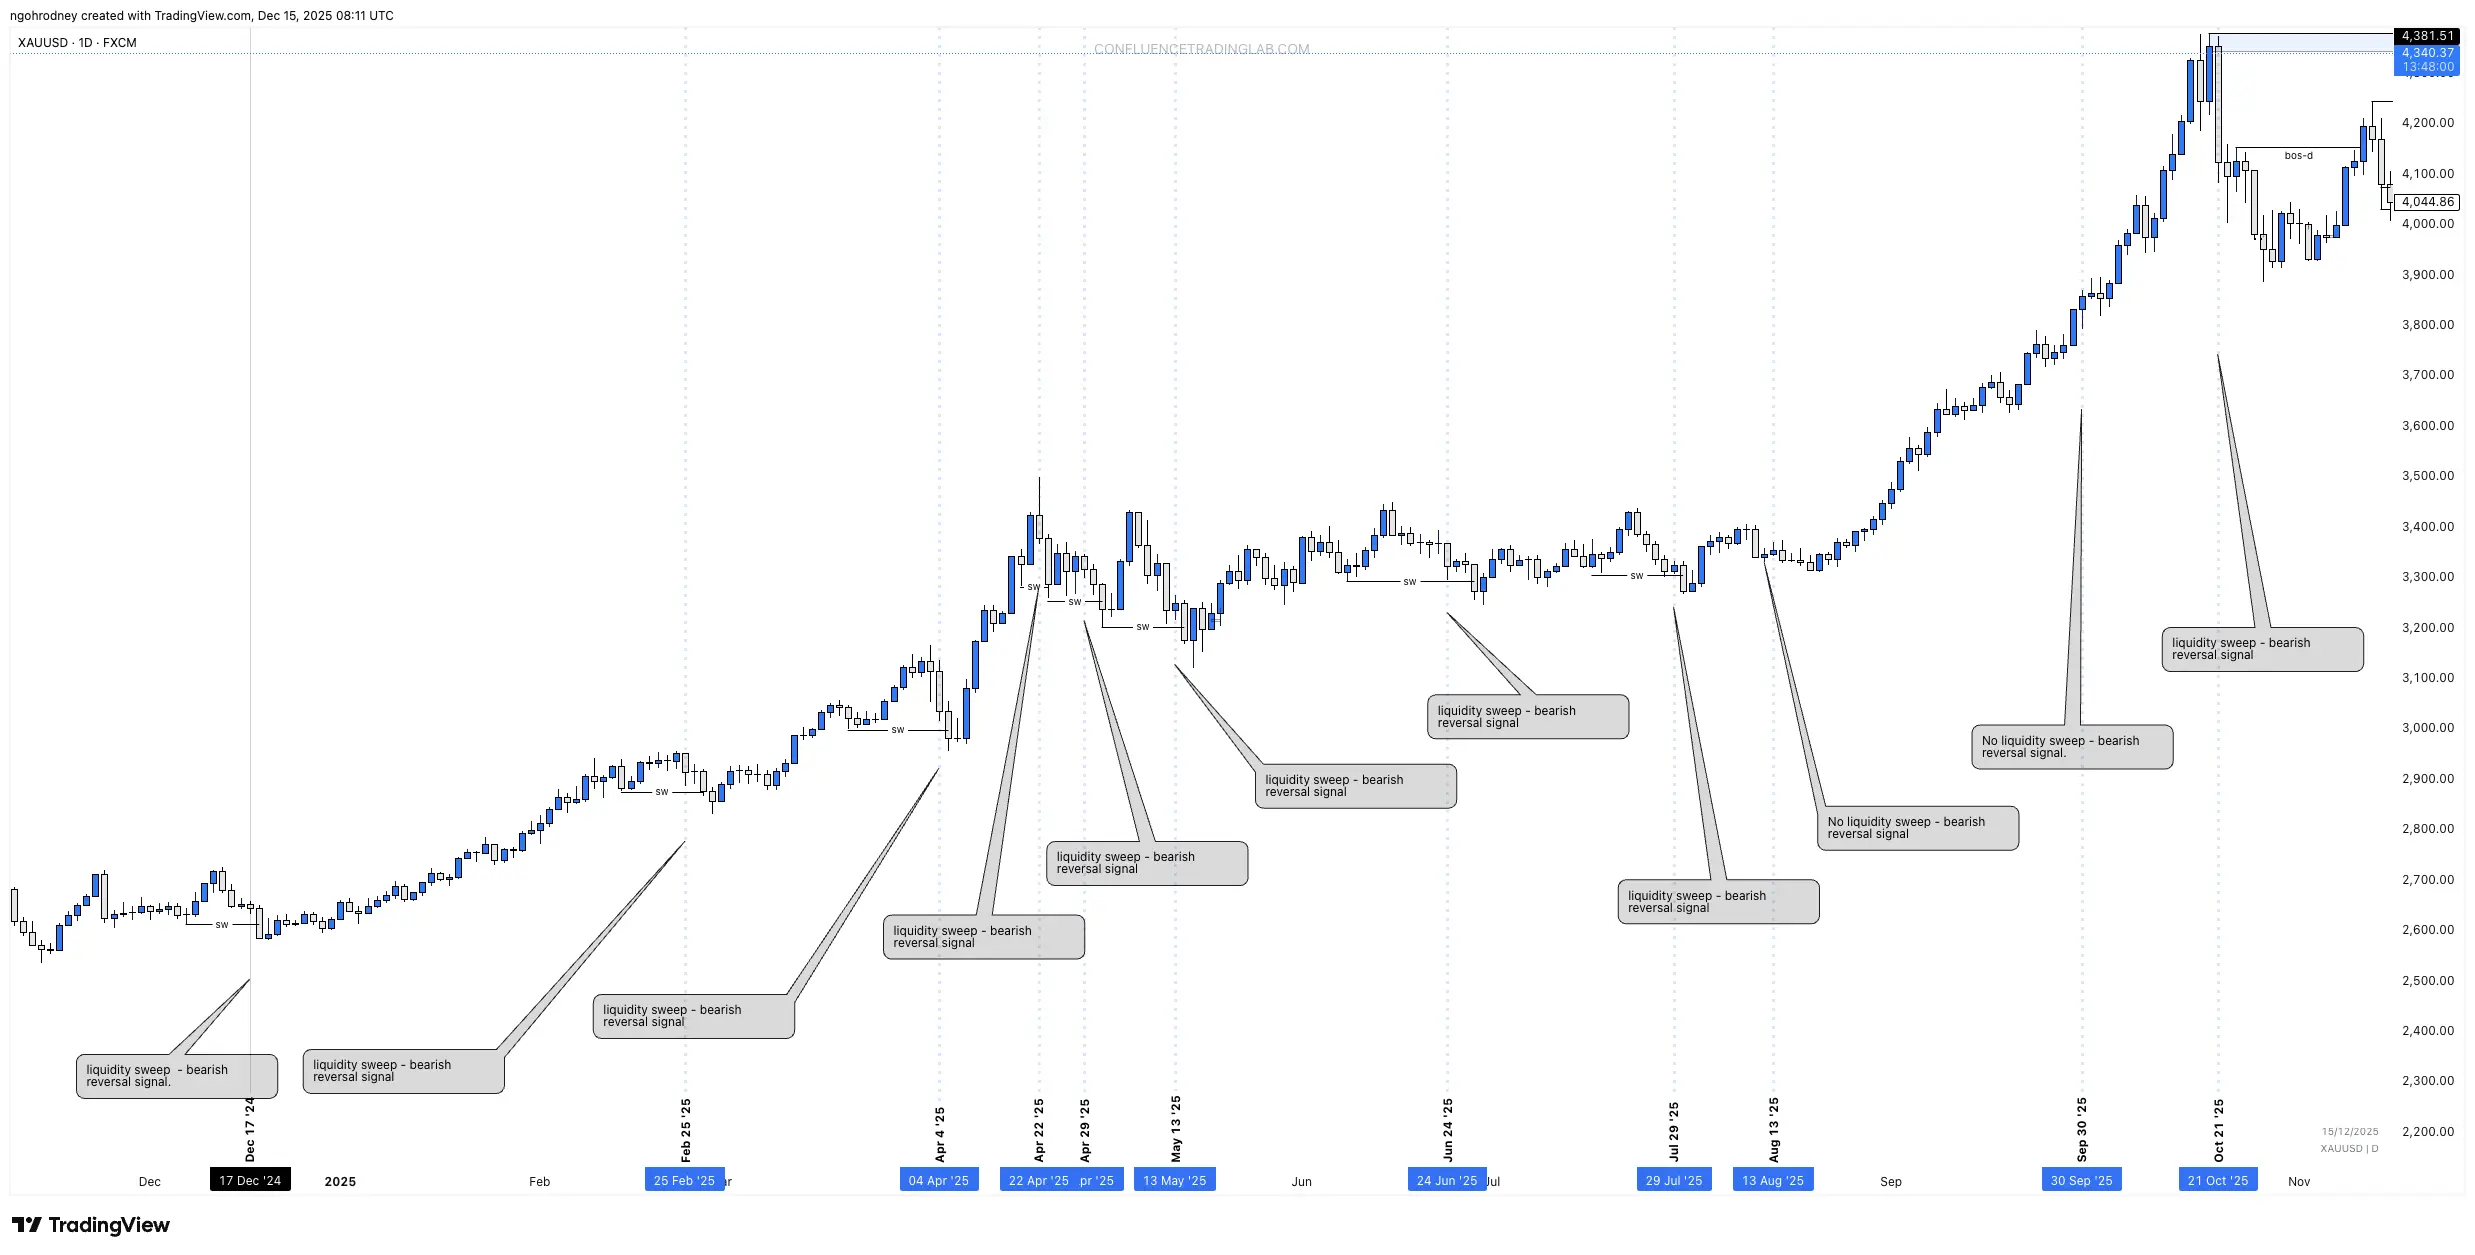 Figure 2: Daily gold price action with COT report analysis (Jan–Dec 2025). Blue vertical lines mark COT reporting dates, and callouts indicates the CTL's COT sentiment Signal and also whether a sweep (sw) occurred after the reporting date.
If you plan to use COT reports in your trading, you are likely interested in holding positions for longer periods—typically more than a couple of weeks. There is little value in using COT data for scalp/intraday trading signals, as its relevance diminishes significantly on very short time horizons.
A quick review of the gold COT report as well as the gold futures market in 2025 reveals how the price action correlated with the COT futures contract report over that period.
Note: It is important to understand that the COT data takes time to play out in the real market. Traders receive the reports on Fridays, three days after the contracts are actually reported. As a result, when analyzing them with the prevailing price action (say on Friday) make allowance for the delay in its release. In some instances, by Friday the futures market might have already priced in the COT data. In other circumstances, it has not. No matter the situation, these reports become more relevant when analyzed over multiple week releases rather than just a single isolated report.
For example, buy future contracts on gold significantly dominated sell future contracts throughout 2025 which correlated with the upward rally of gold futures price that year. After identifying the dominant market movers (buyers) across a series of reports, the key question becomes: how do we participate alongside them in a buyer-dominated futures market?
To answer this, we focus on identifying downward swings (huge downward moves) in the price action. Such downward moves serve as liquidity buildups (sweeps), allowing for potential repricing before the dominant market participants (buyers) resume the original upward move.
Analyzing the gold COT report alongside futures price action is essential for anticipating these swings. From January to December 2025, we observed a recurring pattern: when the COT “Interpretation” column signaled a bearish reversal on a reporting date, price action often followed with a liquidity sweep (a key low being taken) before continuing higher. See Figure 2 for reference.
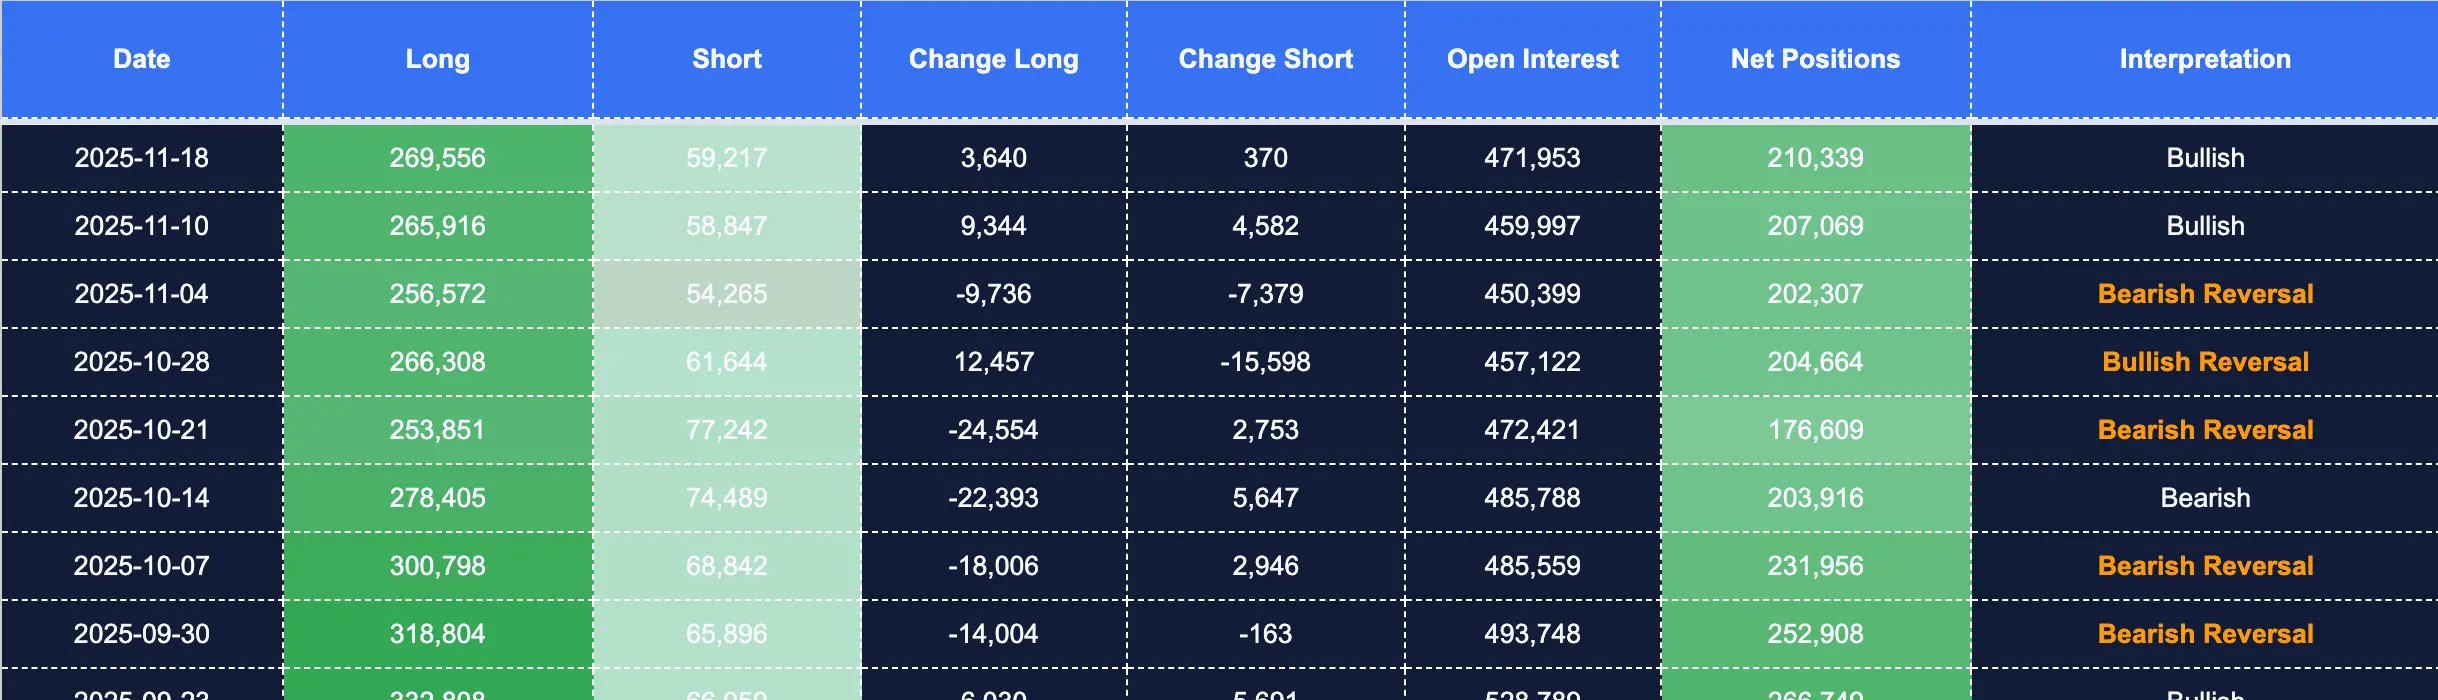 Figure 3: Consecutive gold COT reports with Interpretation (signal) column
In some cases, a follow-up report might signal another "bearish reversal" signal — adding further confirmation and validity to the original signal. This is usually a strong indication of a bullish continuation. However, a "bullish reversal" signal in the "Interpretation" column signals a corrective price move. We don't trade this if the predominant market movers are buyers, but it is a good signal for buyers to take some profits off since a corrective move might be in play soon.
In summary, in an upward market (long futures contracts > short futures contracts), we wait for a "bearish reversal" signal which indicates more buyers are coming into the market and a possible repricing before a continuation of the dominant trend (upward - for gold in 2025). The reverse is true for a downward market (short futures contracts > long futures contracts). Please refer to the image in Figure 2 above for more clarification (you might need to zoom in).
It is important to note that a "bearish reversal" signal does not always lead to a huge downside move (sweep) and sometimes could only serve as an indication to expect higher prices as illustrated in the image in Figure 2 above. Therefore, it is crucial to combine COT data signal with technical analysis to enhance trade timing and decision-making.
In general, trade with the COT reports if you are looking to hold positions for two (2) weeks or longer. In such a case the trader MUST
- Understand higher timeframe structure very well
- Be willing to take partial profits along the way because corrective moves always happen and we can't know for sure where the corrective move will extend to.
- Look out for opposing trade signal e.g. in an upward market, this is a “bullish reversal” or a major weekly, daily or monthly high being breached - indicating it’s time to start closing your trades and wait for another repricing to continue the move.
- Factor in overnight swaps in your trading cost when trading these long term moves otherwise it will be a hidden cost to your profits
Conclusion
In conclusion, COT reports can be a valuable tool for traders looking to understand market direction and make informed trading decisions. By analyzing the positioning of major market participants and combining this information with technical analysis, traders can identify potential trading opportunities and hold positions longer without fear.